Million Song Dataset
SQL Server vs Apache Hadoop Challenge
Luke Merrett & Tim van Wijk
The Challenge
Using a large real life data set, how does using SQL Server compare to Hadoop?
Source Data
The Million Song Dataset, a 280GB (compressed) set of data.
Contains detailed records of the top popular songs across the world.
The data is freely available & frequently used in education.
Could this data set be considered "big data"?
The "4Vs" of Big Data
-
Volume
- An amount of data so large it is difficult to process quickly
-
Velocity
- The speed at which the data is generated makes it difficult to process fast enough to keep up
-
Variety
- The data isn't just a singular agreed form but comes in lots of different, often incompatible formats
-
Veracity
- The quality of the data varies greatly
Do the "4Vs" Apply?
-
Volume - Yes
- 280GB compressed
- The data is sufficiently large that it is difficult to process
-
Velocity - No
- Static data set, the data doesn't change
- The speed we can process it isn't a factor
-
Variety - No
- The data comes in a single format (HDF5)
-
Veracity - Yes
- The data is well structured, but not particularly clean
- Lots of holes, spelling mistakes, malformed info etc
Approaches
Luke will be demonstrating an ETL process with SQL Server
Tim will be showing off how to query the data in Hadoop
Mutual Goal
We have agreed to use our approaches to answer the following questions:
- Q1. What is the average tempo across all the songs in the dataset?
- Q2. Who are the top 10 artists for fast songs (based on tempo)?
- Q3. What are top ten songs based on their hotness in each genre?
Curveball
After we have finished our queries, we will be asking a curveball question to test the validity of each approach with changing requirements.
Constraints
Our company is footing the bill for each approach.
So the cost needs to be small enough that neither of us get fired.
Let's get started...
The SQL Server Approach
Who needs distributing processing eh?
Approach Taken
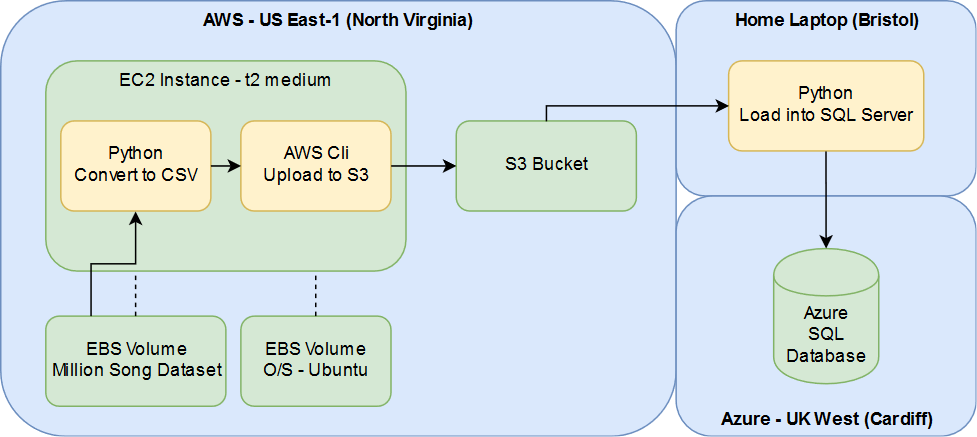
Accessing the Data
AWS provides the Million Song Dataset for us as a 500GB snapshot.
This can be attached for a Linux/Unix machine running in EC2
I used a t2.medium size box (2 cores, 4GB RAM) running Ubuntu to access the data.
Unfortunately the snapshot is only available in the US-East-1 datacenter (North Virginia), hence having to use something in the US
Reading the Files
The data comes in the form of "HDF5" files
This format is designed for high volume data.
Not exactly supported by Microsoft's SQL Server tools.
They do however provide a Python script for querying HDF5 files
Model Being Used
Based on the questions we are answering from the set, I removed all unnecessary columns from our set.
The model that will be output to CSV is:
1: 2: 3: 4: 5: 6: 7: 8: 9: 10: 11: |
|
Converting to CSV
1: 2: 3: 4: 5: 6: 7: 8: 9: 10: 11: 12: 13: 14: 15: 16: 17: 18: |
|
Uploading to S3
Using the AWS Cli this is a doddle:
1: 2: 3: 4: 5: |
|
Loading into SQL Server
Loaded the data in it's raw format into a SQL Server staging table:
1: 2: 3: 4: 5: 6: 7: 8: 9: |
|
Once it's in the database it's easier for us to manipulate.
Cleansing the Data
Now the data is in SQL, we can start to cleanse it ready for querying.
Our target table structure is as follows:
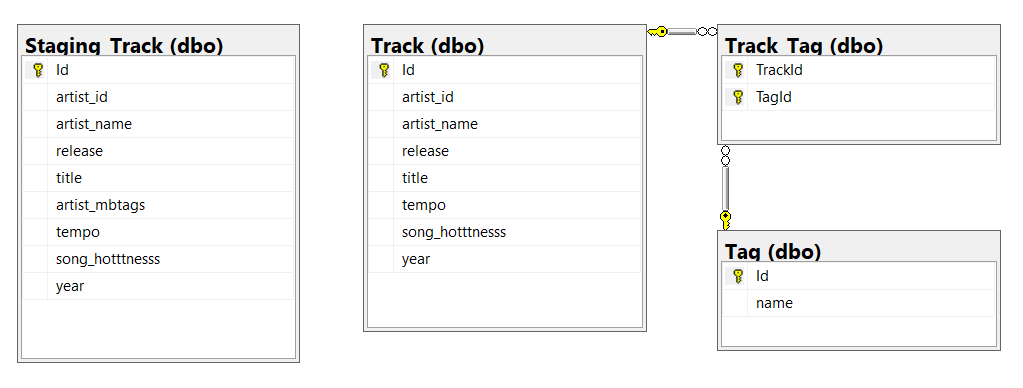
Importing the Tracks
We'll import the tracks first, without the tags:
1: 2: 3: 4: 5: 6: 7: |
|
Parsing the Tags
We'll then parse the tags array into individual rows:
1: 2: 3: 4: 5: 6: 7: 8: 9: 10: 11: 12: 13: 14: |
|
Associating Tags to the Tracks
Finally we'll associate the tags with their original tracks:
1: 2: 3: 4: 5: 6: 7: 8: 9: 10: 11: |
|
(Side note: this is a terrible way of doing it!)
Querying the Data
OK, now the data is loaded, we can start answering the original questions posed
What is the average tempo across all the songs in the dataset?
1: 2: |
|

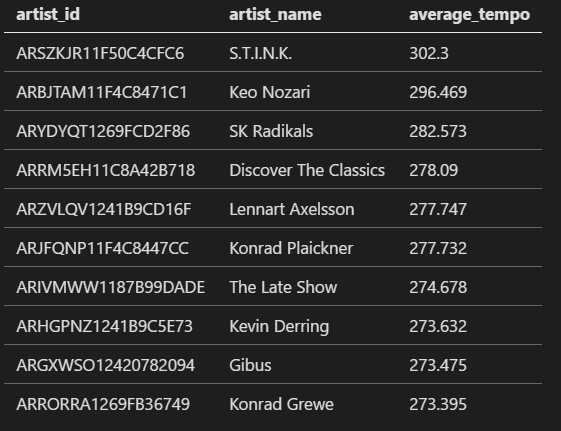
Who are the top ten artists for fast songs (based on their tempo)?
1: 2: 3: 4: 5: 6: 7: |
|
Who are the top ten artists for fast songs (based on their tempo)?
What are top ten songs based on their hotness in each genre?
1: 2: 3: 4: 5: 6: 7: 8: 9: 10: 11: 12: 13: 14: 15: |
|
What are top ten songs based on their hotness in each genre?
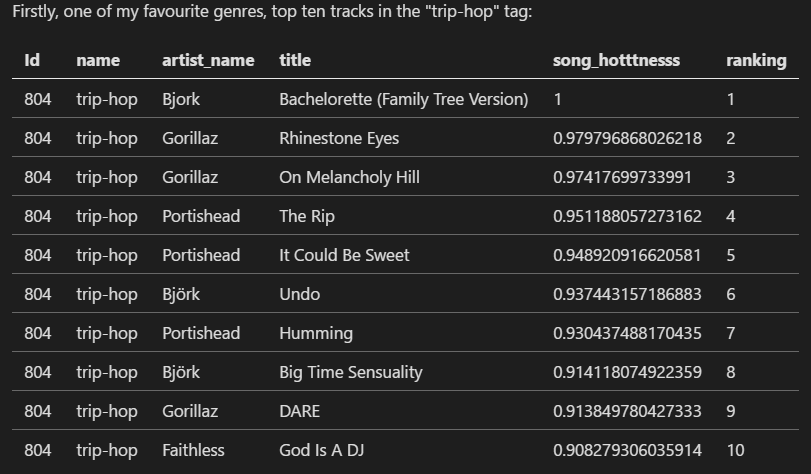
What are top ten songs based on their hotness in each genre?
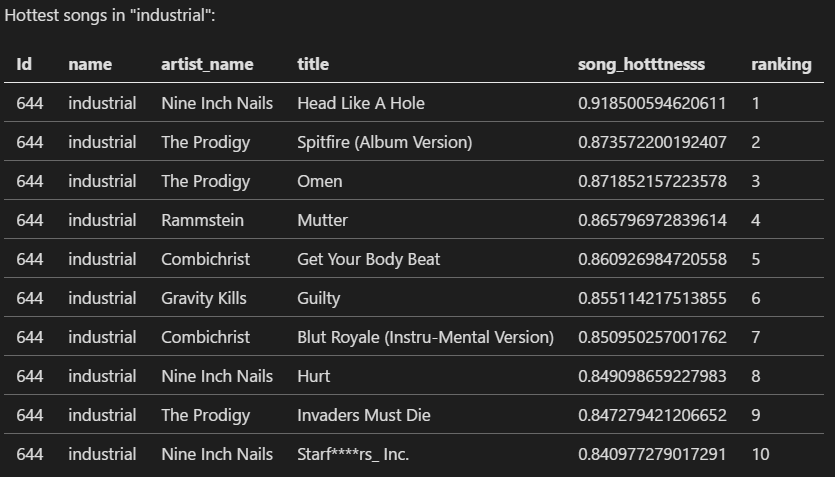
What are top ten songs based on their hotness in each genre?
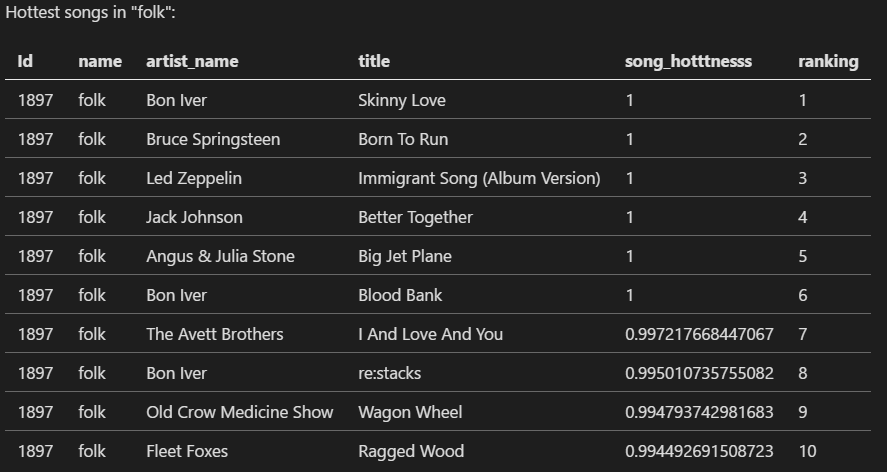
Overall Timings
- 00:10 - Setup AWS EC2 instance
- 10:00 - Export HDF5 data to CSVs
- 00:10 - Upload CSVs to S3
- 00:15 - Setup Azure SQL Database Instance
- 00:10 - Download CSVs for import into SQL
- 02:00 - Import the raw data into the database
- 04:52 - Cleanse data for querying
- 00:05 - Run queries to answer the questions proposed
Total time taken: 17 Hours 42 Minutes
Total Cost
Estimates based on time the infrastructure was live:
EBS Volumes |
£25.00 |
EC2 Instance |
£2.00 |
S3 Storage |
£0.02 |
SQL Database |
£14.00 |
Total |
£41.02 |
Curveball
Which countries have the most punk artists by year across the set?
As I needed to cut down the data to just the columns we're interested in, we'd have to rerun the whole approach to gather the location details.
Would need to use geospatial queries in SQL Server, which would increase the time required to load the data.
The Hadoop Approach
Because this would be a useless talk without it
Source Data
- Million Song Dataset
- 500GB AWS EBS Snapshot
- 1M HDF5 files
ETL Process
Extract and Transform

ETL Process
1: 2: 3: 4: 5: 6: 7: 8: 9: 10: 11: 12: 13: |
|
ETL Process
Load

ETL Process
1: 2: 3: 4: 5: 6: 7: 8: 9: 10: 11: 12: 13: 14: 15: 16: |
|
Querying
Let's do it...
Time & Cost
Time taken for ETL
- 2x Workers ~ 3.5hrs
Cost to import
- 3x EC2 Instances
- 3x 500GB EBS Volume
- 3.5hrs x \(0.58/hr =\)2.10 (£1.50)
Time & Cost
Time taken for Queries
Query |
Time |
Cost |
|---|---|---|
1 |
00:00:25.53 |
0.2p |
2 |
00:00:38.76 |
0.3p |
3 |
00:00:36.56 |
0.3p |
Total |
00:01:04.29 |
0.8p |
Curveball
Which countries have the most punk artists by year across the set?
As all the data is loaded using Hive, no additional import is needed.
In terms of querying; Hadoop does provide GIS functionality so we could use the lat/long to answer this question.
Conclusions
Advantages of Hadoop Approach
- Hadoop cost less for the ETL and was faster
- Can increase the size of the cluster to speed up the ETL
- Was able to load the whole data set, not a subset of columns
- Much less transformation of the data to get it into Hive
- Faster to start exploring a large data set
Advantages of SQL Server Approach
-
Hadoop cluster would cost most to keep online permenantly
- SQL is cheaper if you need persistent access to the data
-
Takes 10 minutes to spin up the Hadoop cluster for querying
- SQL is always running at a relatively low cost on Azure
Any Questions?